
Googles quality score can have a big effect on how your ads and your website are perceived. This score is made up of Googles ideas about the relevance of your keywords, landing page, advertising campaigns and many other factors, and if its not high enough, you could pay a lot more for your ads or find them in unappealing locations.
The good news is that you can control your quality score by choosing more relevant keywords, focusing on geographic performance, and improving your landing page. Not all methods of improving the quality score are created equal, however, and Google doesnt make it easy to tell how well your efforts are working. Thats why its so important to learn how to create a quality score report to help you track your progress.
How Reports Can Help
If youd like to improve the quality score on your account, you need two major things. First, youll require a way to keep track of your progress. Next, youll need to have a way to determine which ad groups, keywords and individual ads should get the most attention. You could work this out by hand, but it tends to be complex and require a lot of tables. Alternatively, you can create an automated report that shows the history of your quality scores, giving you all the information you need quickly and easily.
Collecting the Data
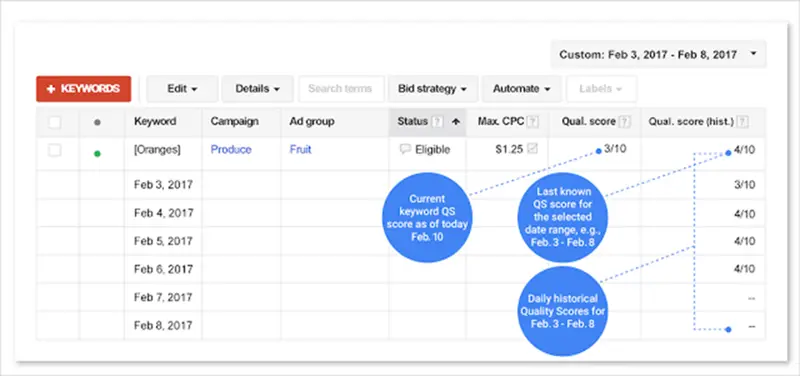
The best way to get a historical quality score report for Adwords is to use scripting techniques. Its actually relatively easy to create a small program that will go through every keyword on your account and save its quality score, number of impressions and other information. If you have trouble keeping the script active because you have too many keywords, just set your script to pay attention only to the ad campaigns with the highest volume.
Once youve collected all of this keyword information, its relatively simple to use it to build quality score tables for every ad group, as well as for your accounts overall score. You can weight these tables by the number of ad impressions, allowing you to determine which keywords need a lot of attention and which ones simply arent worth your time.
Figuring the Weighted Quality Score
Weighting your tables might seem confusing or intimidating at first, but its actually relatively simple. All you need to do is figure out what percentage of the impressions for each ad group go to the individual keywords. Then, multiply this number by the quality score for a specific keyword to get the weighted value for that term. Once youve determined all the weighted scores, you can add them together to determine the quality score for the entire ad group. Scripts make automating this process relatively easy.
Building the Report
After youve performed these calculations, youll have a lot of potentially useful numbers, but you might not know what to do with them.Ideally, you should design your quality score report script to push all of the data it collects and processes into a Google spreadsheet. You can schedule the script to run once every day, recording all the information to the spreadsheet. This creates a historical record of your accounts quality score over time. If you tweak your script a little, you can even get it to tell you the names of the ad groups that you should spend the most time optimizing. While it can take a little while to set up, this ingenious tool is completely worthwhile for anyone who wants to improve their quality score based on solid information.
Using the Report
Once you have the ability to track your data, its time to start using it for your Adwords accounts benefit. Take a look at your keyword list and determine which ones have the worst scores. Theres a good chance that Google doesnt really consider them relevant to your ads. Instead of focusing only on driving traffic to your site, make sure that you choose keywords that are highly relevant to your campaign.
Skip out on all the search terms that arent related to what you do and add them to your negative keyword list. Pay attention to themes and group your keywords into particular ad groups to help you focus on one market or geographical area. Make sure each group has its own set of ads, and keep track of how each one does. Your report will help you easily see how the individual ads and keywords affect your Google quality score.
Once youve adjusted your keywords based on the information you got from building your report, its time to take a look at your landing page. It should be relevant, clear and easy to navigate, and capable of delivering the content that your visitors want to see. Avoid overly fancy graphics or excessive amounts of text, which can drive your visitors away and destroy your quality score. Once you refine your page, theres a good chance that youll see your score go up.